Animated Laptop with Data Analysis Charts and Magnifying Glass
By PlishMotionOne great value subscription from €14.50/month
- Unlimited downloads of 27+ million creative assets
- AI Tools: video, image and more
- Lifetime commercial license
- Easy cancellation
Already have an account? Sign in
Attributes
- Length
- 0:09
- Resolution
- 3840 x 2160
- File Size
- 226 MB
- Frame Rate
- 30 fps
- Alpha Channel
- Yes
- Looped
- No
- Video Encoding
- ProRes
- Orientation
- Horizontal
- Commercial License
- Further Information
Description
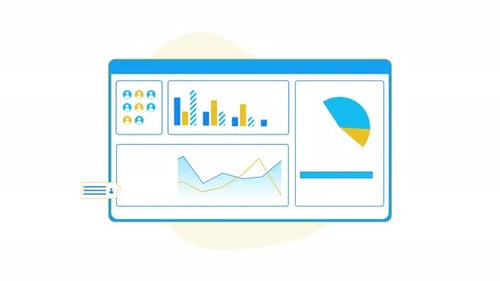
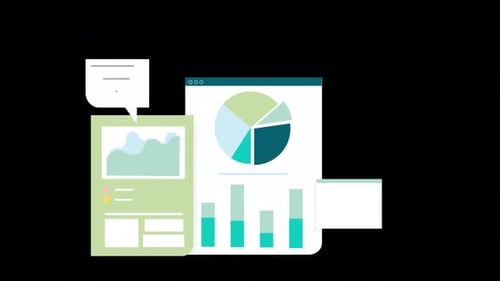
This animated clip features a stylized laptop displaying a dynamic data analysis interface. Bar graphs, pie charts, and line graphs sequentially animate onto the screen, illustrating various statistical data points. A large red magnifying glass then moves across the screen, emphasizing the detailed examination of the presented metrics. Speech bubbles and additional graphical elements appear around the laptop, enhancing the narrative of communication and insights. This modern, flat design animation is ideal for corporate presentations, technology explainers, business reports, and educational content focused on data visualization and analytics, providing a clear and engaging way to represent complex information.