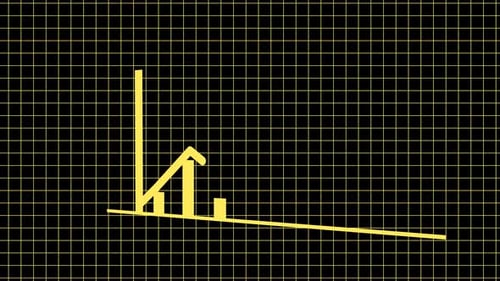
Animated Yellow Bar Chart Showing Steady Growth on Black Background
By MarkWood2023One great value subscription from €14.50/month
- Unlimited downloads of 27+ million creative assets
- AI Tools: video, image and more
- Lifetime commercial license
- Easy cancellation
Already have an account? Sign in
Attributes
- Length
- 0:10
- Resolution
- 3840 x 2160
- File Size
- 470 KB
- Frame Rate
- 30 fps
- Alpha Channel
- No
- Looped
- No
- Video Encoding
- H.264
- Orientation
- Horizontal
- Commercial License
- Further Information
Description
This animated sequence presents a vibrant yellow bar chart that meticulously constructs itself against a deep black background, offering a stark and high-contrast visual for data representation. The animation begins with the appearance of the X and Y axes, indicated by sharp arrows, followed by a series of vertical bars that rise sequentially from left to right. A diagonal line featuring a terminal circular node tracks the peak of the data, reinforcing the visual narrative of continuous upward momentum and statistical progress. The execution utilizes a clean flat design aesthetic, characterized by solid colors and geometric precision, ensuring that the focus remains entirely on the information being conveyed. This visual tool is expertly crafted for integration into corporate presentations, financial analysis videos, and educational modules where clear communication of growth trends is paramount. Its professional pacing and polished look allow creators to effectively illustrate concepts of success, market expansion, and performance metrics without unnecessary visual clutter. The high-contrast color palette ensures readability across various digital platforms, making it a reliable choice for high-impact communication.