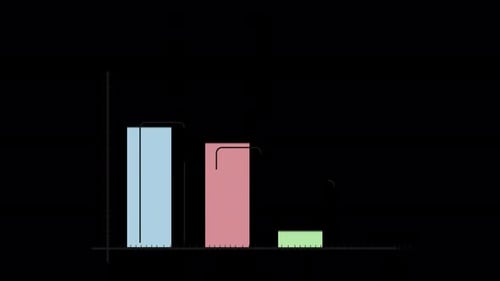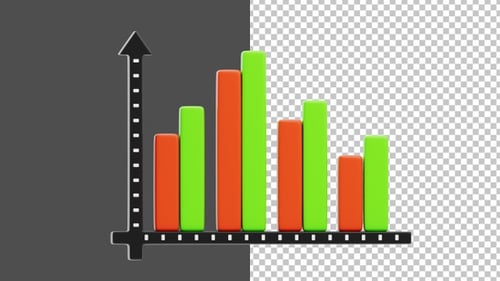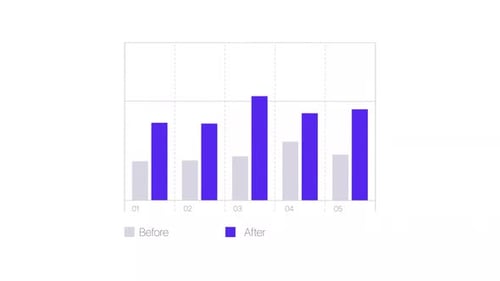
Animated Before After Bar Graph for Data Comparison
By bsd-studioOne great value subscription from €14.50/month
- Unlimited downloads of 27+ million creative assets
- AI Tools: video, image and more
- Lifetime commercial license
- Easy cancellation
Already have an account? Sign in
Attributes
- Length
- 0:30
- Resolution
- 1920 x 1080
- File Size
- 212 MB
- Frame Rate
- 30 fps
- Alpha Channel
- Yes
- Looped
- Yes
- Video Encoding
- ProRes
- Orientation
- Horizontal
- Commercial License
- Further Information
Description
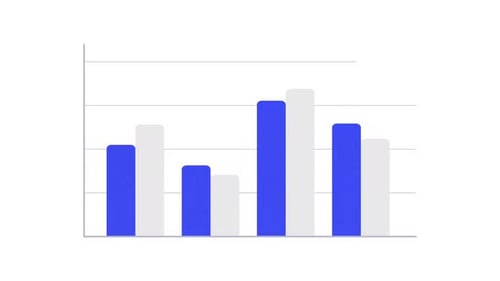
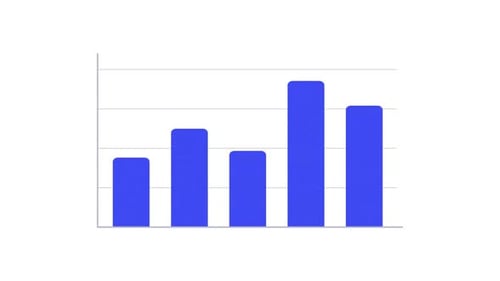
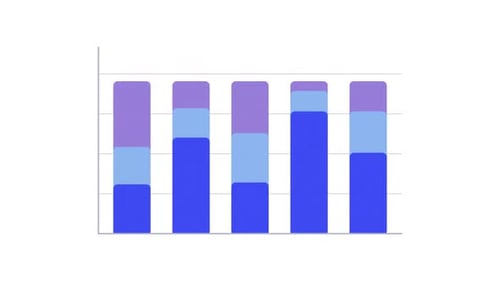
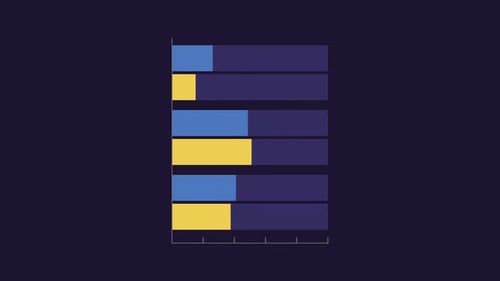
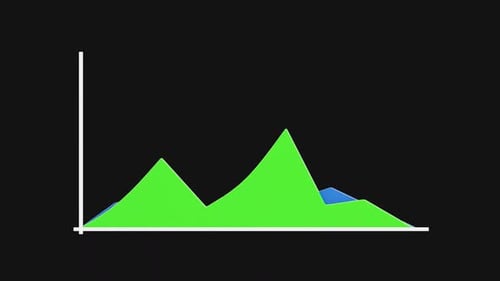
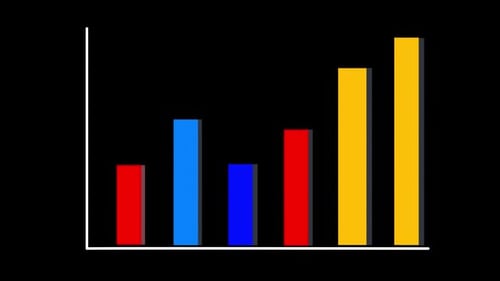
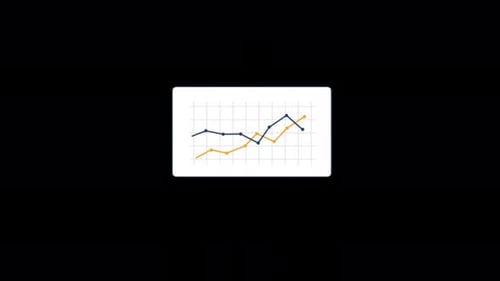
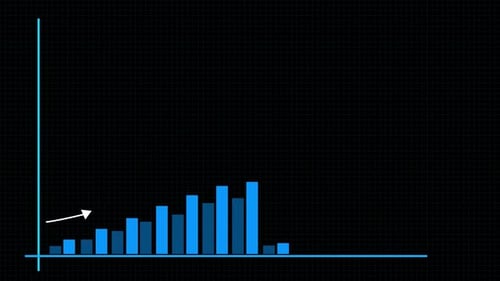
This animated bar graph visually demonstrates data comparison with a clear "Before" and "After" representation. The initial "Before" bars are shown in a muted tone, while the "After" bars elegantly animate upwards in a vibrant color, highlighting growth or change. The design features a clean, minimalist aesthetic with flat, solid colors and a clear grid, making it easy to understand complex information at a glance. This motion graphic is ideal for corporate presentations, business reports, financial analysis, or any project requiring a professional and effective way to illustrate data trends and performance. It offers a straightforward and impactful visual tool for showcasing improvements or differences over time.