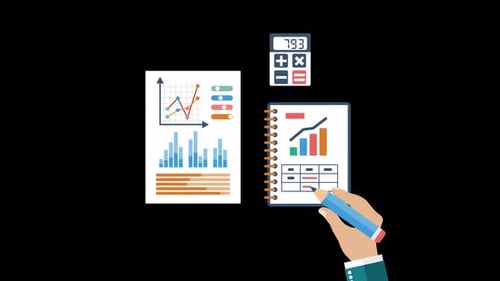
3D Data Analysis Animation with Magnifying Glass and Graphs
By UnerispaceOne great value subscription from €14.50/month
- Unlimited downloads of 27+ million creative assets
- AI Tools: video, image and more
- Lifetime commercial license
- Easy cancellation
Already have an account? Sign in
Attributes
- Length
- 0:09
- Resolution
- 2560 x 1440
- File Size
- 211 MB
- Frame Rate
- 30 fps
- Alpha Channel
- Yes
- Looped
- No
- Video Encoding
- ProRes
- Orientation
- Horizontal
- Commercial License
- Further Information
Description
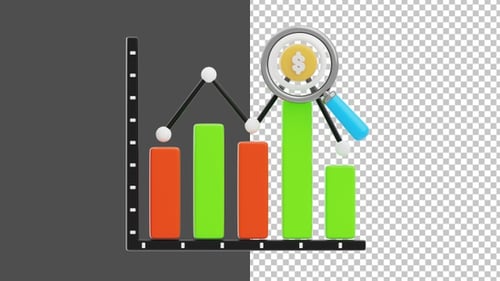
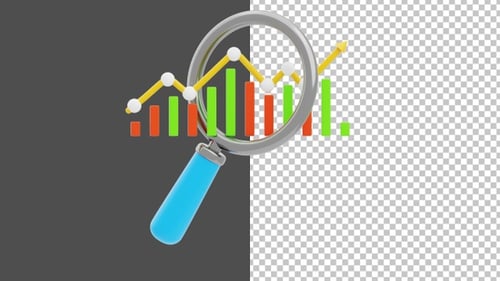
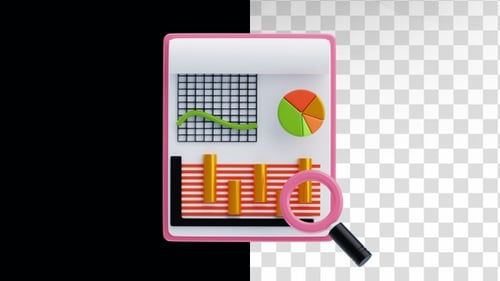
This high-quality animated illustration depicts a detailed data analysis process through stylized 3D documents and a functional magnifying glass. Two white paper documents emerge into the frame, with colorful line graphs and data charts populating the pages in a fluid, rhythmic motion. A blue magnifying glass featuring a rotating yellow icon drifts across the scene, inspecting the various data points as they are visualized. The clean and modern aesthetic uses a simple color palette of white, blue, and yellow to create a professional look suitable for many industries. This animation is rendered with an alpha channel, making it a versatile tool for editors to overlay directly onto their existing footage or branded backgrounds. It is an ideal addition to corporate presentations, financial reports, or educational content focused on statistics and research. The smooth transitions and refined 3D modeling help to elevate the visual quality of any professional project, providing a clear and engaging way to represent complex data in a simplified and approachable visual format for audiences to easily understand.