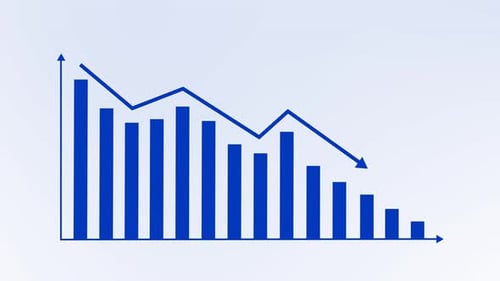
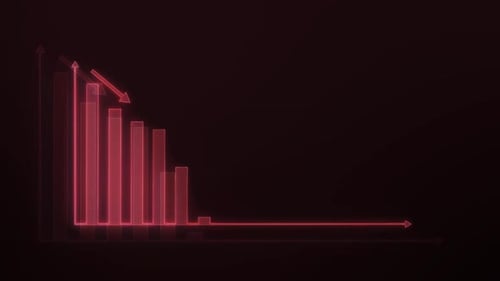
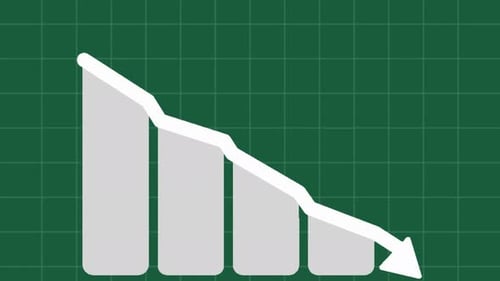
Glowing Bar Chart Animation with Declining Trend Line
By CSSF360One great value subscription from €14.50/month
- Unlimited downloads of 27+ million creative assets
- AI Tools: video, image and more
- Lifetime commercial license
- Easy cancellation
Already have an account? Sign in
Attributes
- Length
- 0:07
- Resolution
- 3840 x 2160
- File Size
- 1.47 MB
- Frame Rate
- 29.97 fps
- Alpha Channel
- No
- Looped
- No
- Video Encoding
- H.264
- Orientation
- Horizontal
- Commercial License
- Further Information
Description
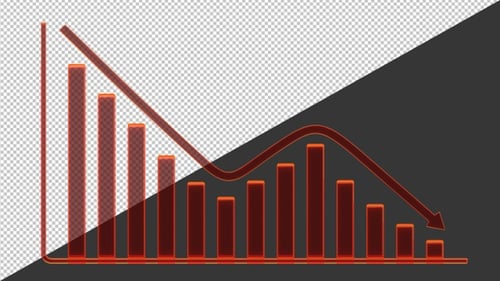
This animated visual effect presents a sleek, glowing bar chart with an accompanying trend line, perfect for illustrating data analysis and business performance. The animation begins with the gradual formation of the x and y axes, followed by a dynamic build-up of individual glowing bar segments. As the bars populate the chart, a distinct line graph overlays them, meticulously tracing a downward trajectory. This modern data visualization tool is ideal for showcasing declining trends, negative growth, or decreased metrics in corporate presentations, financial reports, economic analyses, or educational content. Its clean design and smooth animation provide a professional and impactful way to convey complex data with clarity and precision, making it a versatile asset for various digital projects requiring statistical representation.