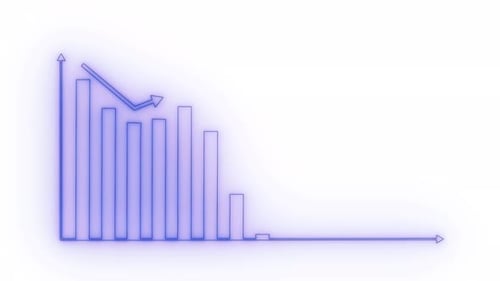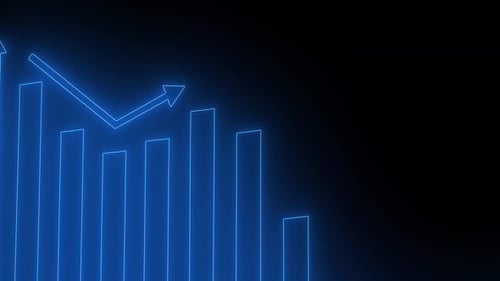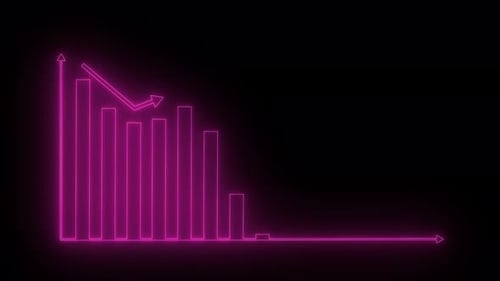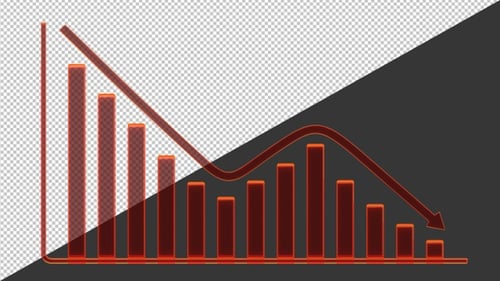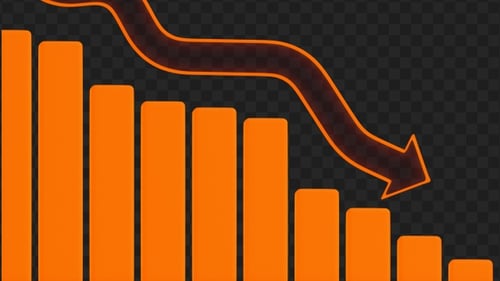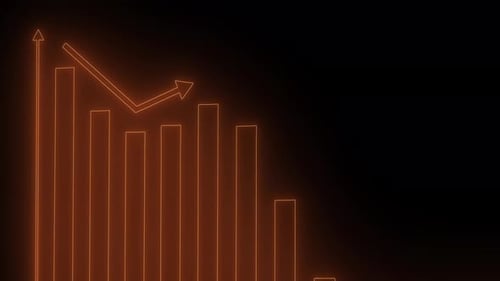
Neon Bar Graph and Arrow Line Showing Business Decline
By CSSF360One great value subscription from €14.50/month
- Unlimited downloads of 27+ million creative assets
- AI Tools: video, image and more
- Lifetime commercial license
- Easy cancellation
Already have an account? Sign in
Attributes
- Length
- 0:07
- Resolution
- 3840 x 2160
- File Size
- 3.2 MB
- Frame Rate
- 29.97 fps
- Alpha Channel
- No
- Looped
- No
- Video Encoding
- H.264
- Orientation
- Horizontal
- Commercial License
- Further Information
Description
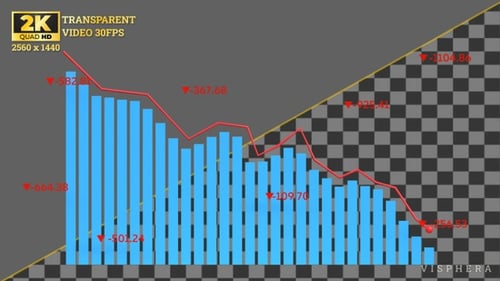
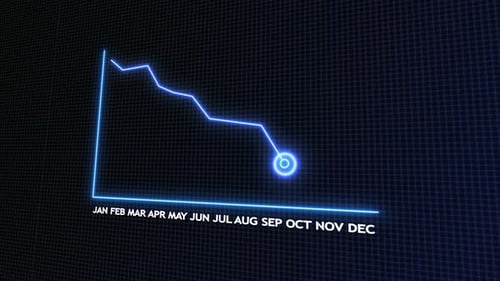
This animated clip presents a dynamic bar graph rendered in striking neon lines against a dark background. Individual bars appear sequentially, fluctuating in height to represent data points, while a glowing arrowed line charts an initial ascent followed by a clear, sustained decline across the visualized metrics. The vibrant orange glow creates a modern, high-tech aesthetic, drawing immediate attention to the displayed information. This visual effect is ideal for enhancing presentations, financial reports, or business analyses, effectively illustrating downward trends, losses, or negative performance indicators in a visually engaging and impactful manner. It provides a clean, yet energetic way to convey complex data with a sleek digital feel.